NOTE: This blog post is based on this notebook.
This post takes OSMnx’s street network analysis capabilities and applies them onto a small market town in England. It considers whether the betweenness centrality and closeness centrality values reflect real-world characteristics that a local person would recognise.
Street junctions coloured by betweenness centrality
Of the two network metrics that we are going to look at, betweenness centrality measures the extent to which each node in a network is ‘between’ all of the others. The shortest paths between every pair of nodes in the network are calculated and then every node in the network is given a score based on the proportion of these shortest paths that pass through it. It can be seen as a measure of how critical a node is to the network and a means of identifying bottlenecks.
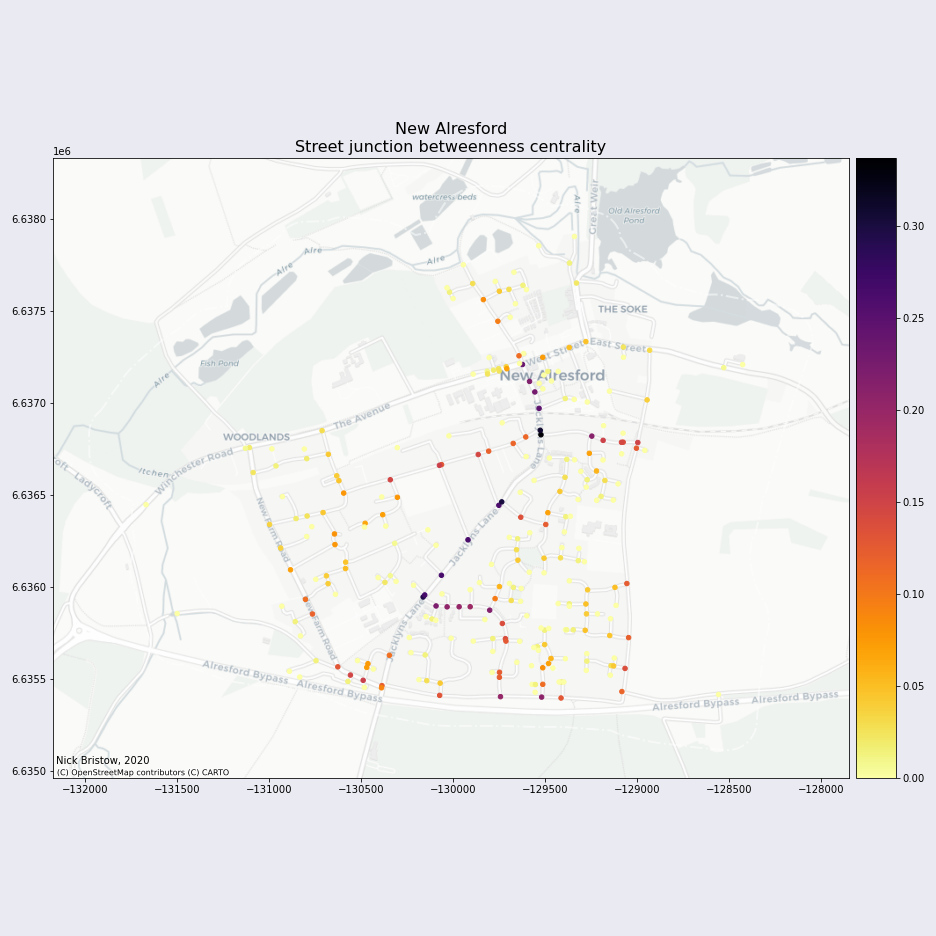
New Alresford is split by a railway line running east-west, few streets cross the railway line. The southern part of the town is also largely made up of cul-de-sacs largely preventing east-west permeability. This leaves Jacklyns Lane as one of the few streets that links both the east and west sides of the southern part of the town and the southern part underneath the railway to the northern part.
The map below shows that the betweenness centrality measures and what we know of the town itself coincide:

Street junctions coloured by closeness centrality
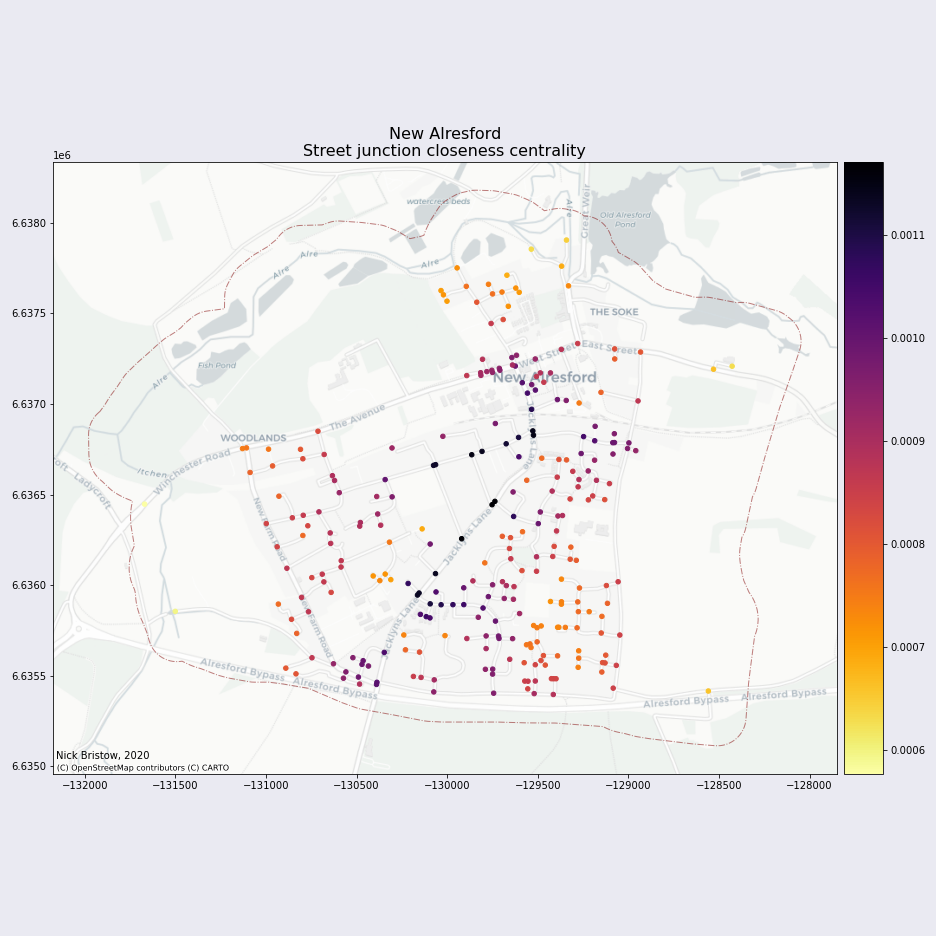
The importance of Jacklyn’s Lane to Alresford’s street network (its betweenness centrality) is mirrored by how accessible the rest of the town is from it (its closeness centrality). Closeness centrality is relative indicator of how close each node in the network is to all of the other nodes in the network.
By plotting Alresford’s street junctions coloured by their closeness centrality we can visualise the points in the town from which it is easiest (in terms of distance along the street network) to reach the rest of the town. Again Jacklyn’s Lane stands out:

What is closeness centrality really showing us?
One way to think about closeness centrality would be to think about how/where to locate public services in the town such that the distance that everyone in the town has to travel to reach them is minimised. Looking at the map above, in terms of the street network at least, it seems reasonable that Jacklyn’s Lane could be assumed to be the centre of the town but how confident can we be that this is actually the case? If we asked someone in Alresford to direct us to the town centre is this where they would send us?
Alresford is quite a discrete entity. The town is surrounded by countryside and for a local street analysis we can be fairly confident that we have identified an appropriate town boundary for a local scale street network analysis but it is important to keep in mind that closeness centrality is a relative measurement - it assesses the closeness of each node to all of the other nodes in whatever the network is that we have chosen. By changing the bounds of our initial network selection we will change the measured closeness centrality of each node.
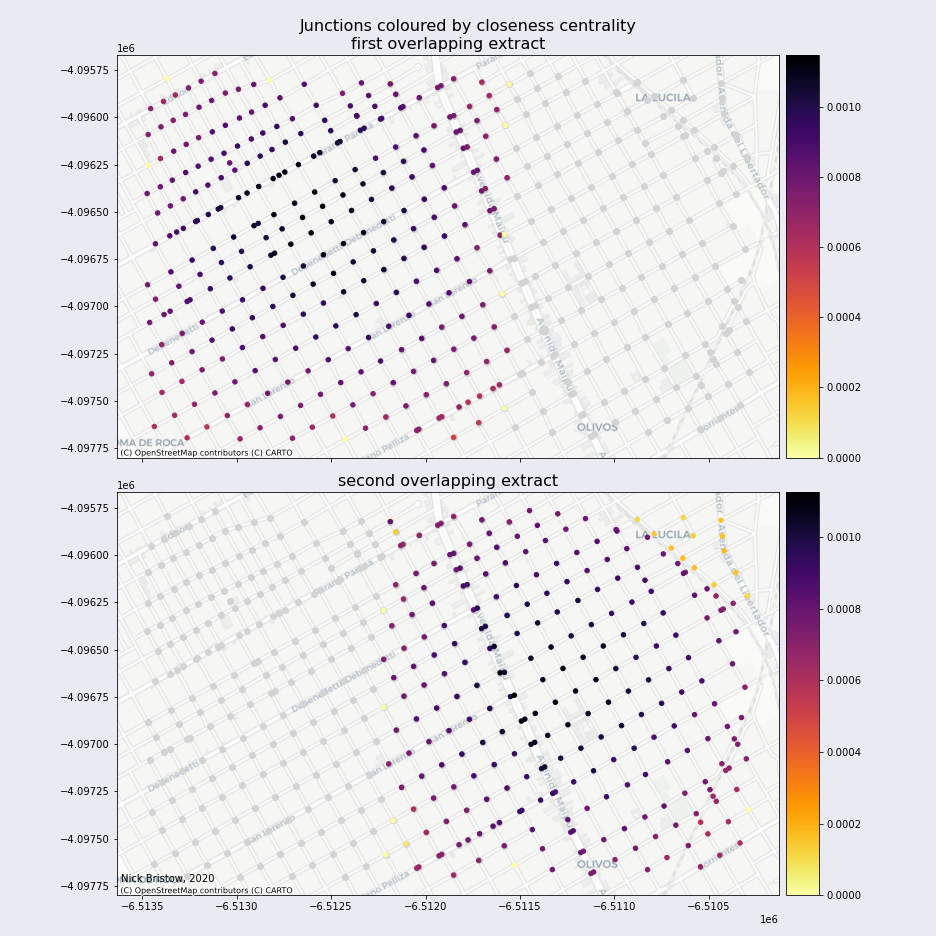
The significance of this initial selection can be illustrated by extracting two overlapping sets of street junctions from one area in a city with a very regular street network. Generating the same closeness centrality metrics for both extracts and plotting each one of them in turn, we can see that nodes/junctions that appear in both extracts have different values depending on which extract they are calculated for. In this case, where there is no obvious clear edge to the network that we are analysing, the simple closeness centrality values of each junction don’t really tell us anything other than their relative position within the arbitrary area that we chose to extract from the larger network:

The next blog post will take an alternative approach to identifying Alresford’s town centre and then carry out a simple accessibility analysis to show whether this small market town aligns in any way with the contemporary focus on active modes of transport (walking and cycling) and 15 minute neighbourhoods.