NOTE: This notebook accesses the data for this post, this notebook processes it.
The previous post looked at the existing densities of towns and cities in England and Wales using the Office for National Statistic’s (ONS) Built Up Areas. In order to start moving down through the geographic scales we need to change our definition of Greater London from its Built Up Area to its political boundary. This post compares these two definitions of the city and their measured dwelling densities.
The Built Up Area
The ONS publication “2011 Built-up Areas - Methodology and Guidance” sets out how Built Up Areas were defined. In simplified terms:
- A 50x50m grid was laid over the Ordnance Survey’s MasterMap Topography Layer
- The percentage of each grid square covered by four nominal National Land Use Database (NLUD) classes was identified
- If minimum percentages were met the grid square was classified as urban
- Neighbouring urban grid squares were merged together
- If the merged area was greater than 200,000m2 it was classified as a Built Up Area
The political boundary
Political/administrative boundaries are defined rather differently but there are two key differences that are most important for our purposes:
- Unlike built up areas, political/administrative boundaries have to be contiguous i.e. there aren’t any gaps between them.
- For electoral reasons, political and administrative areas are designed to contain an approximately equal number of voters.
The first point means that large green areas of national significance (such as the North Downs) have to be included within one Local Authority or the other - the built up areas simply omit them.
The second point means that boundaries are primarily defined for demographic reasons and so they can have a somewhat arbitrary relationship with physical geography.
The effects
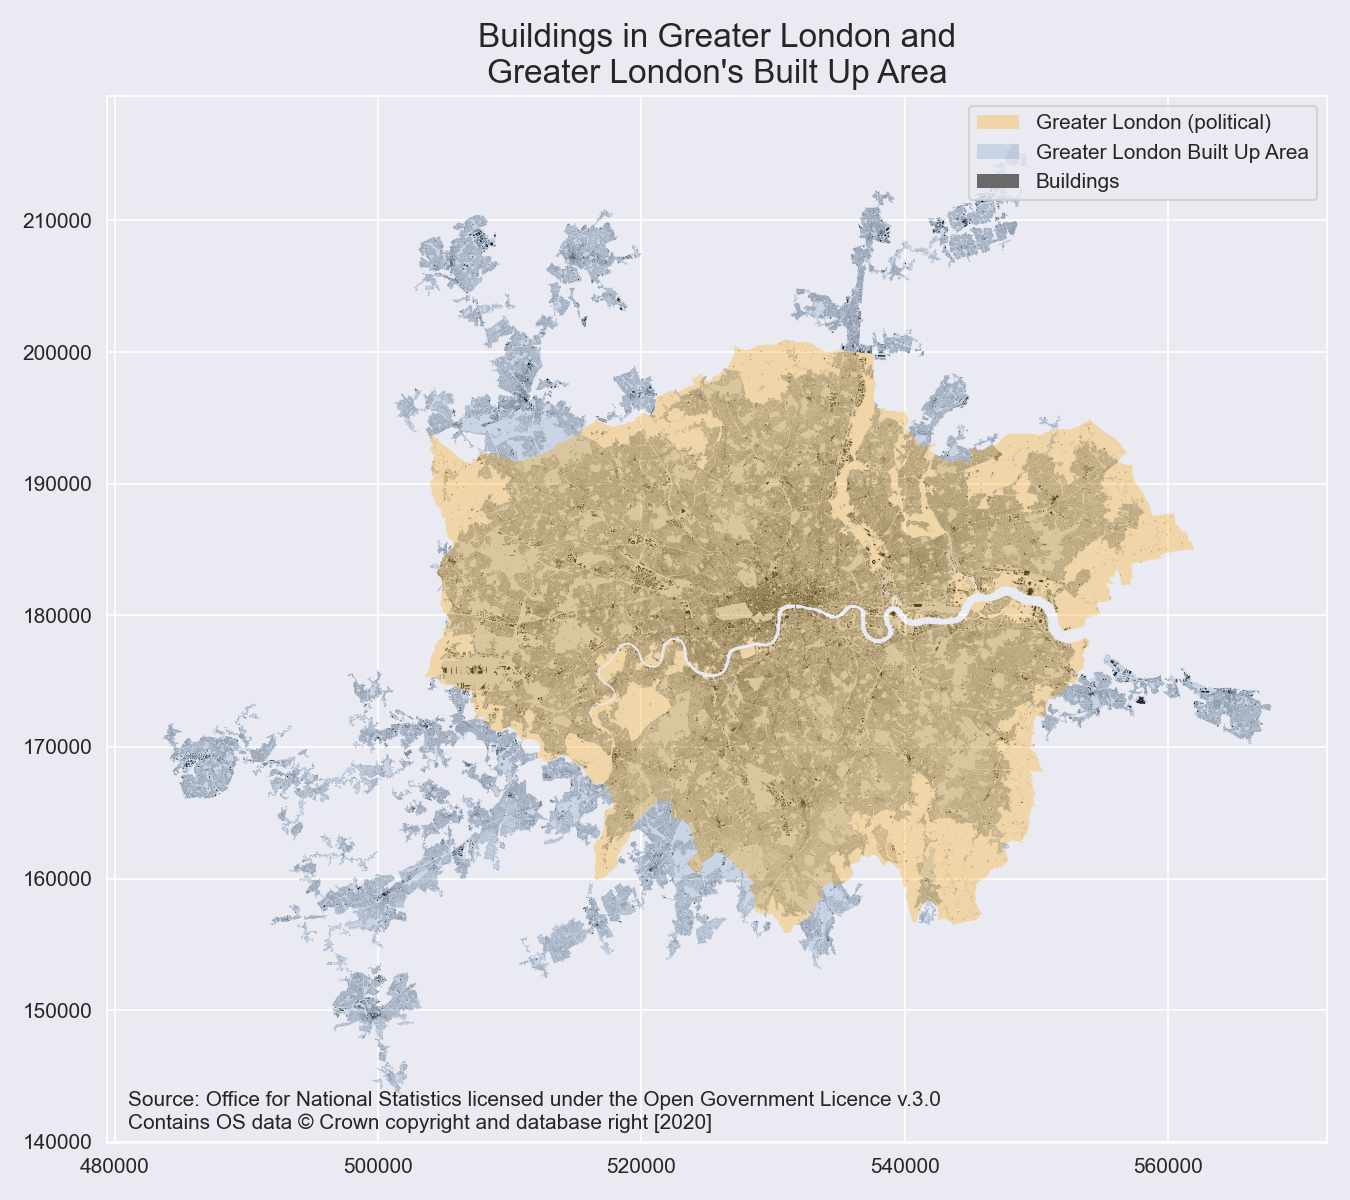
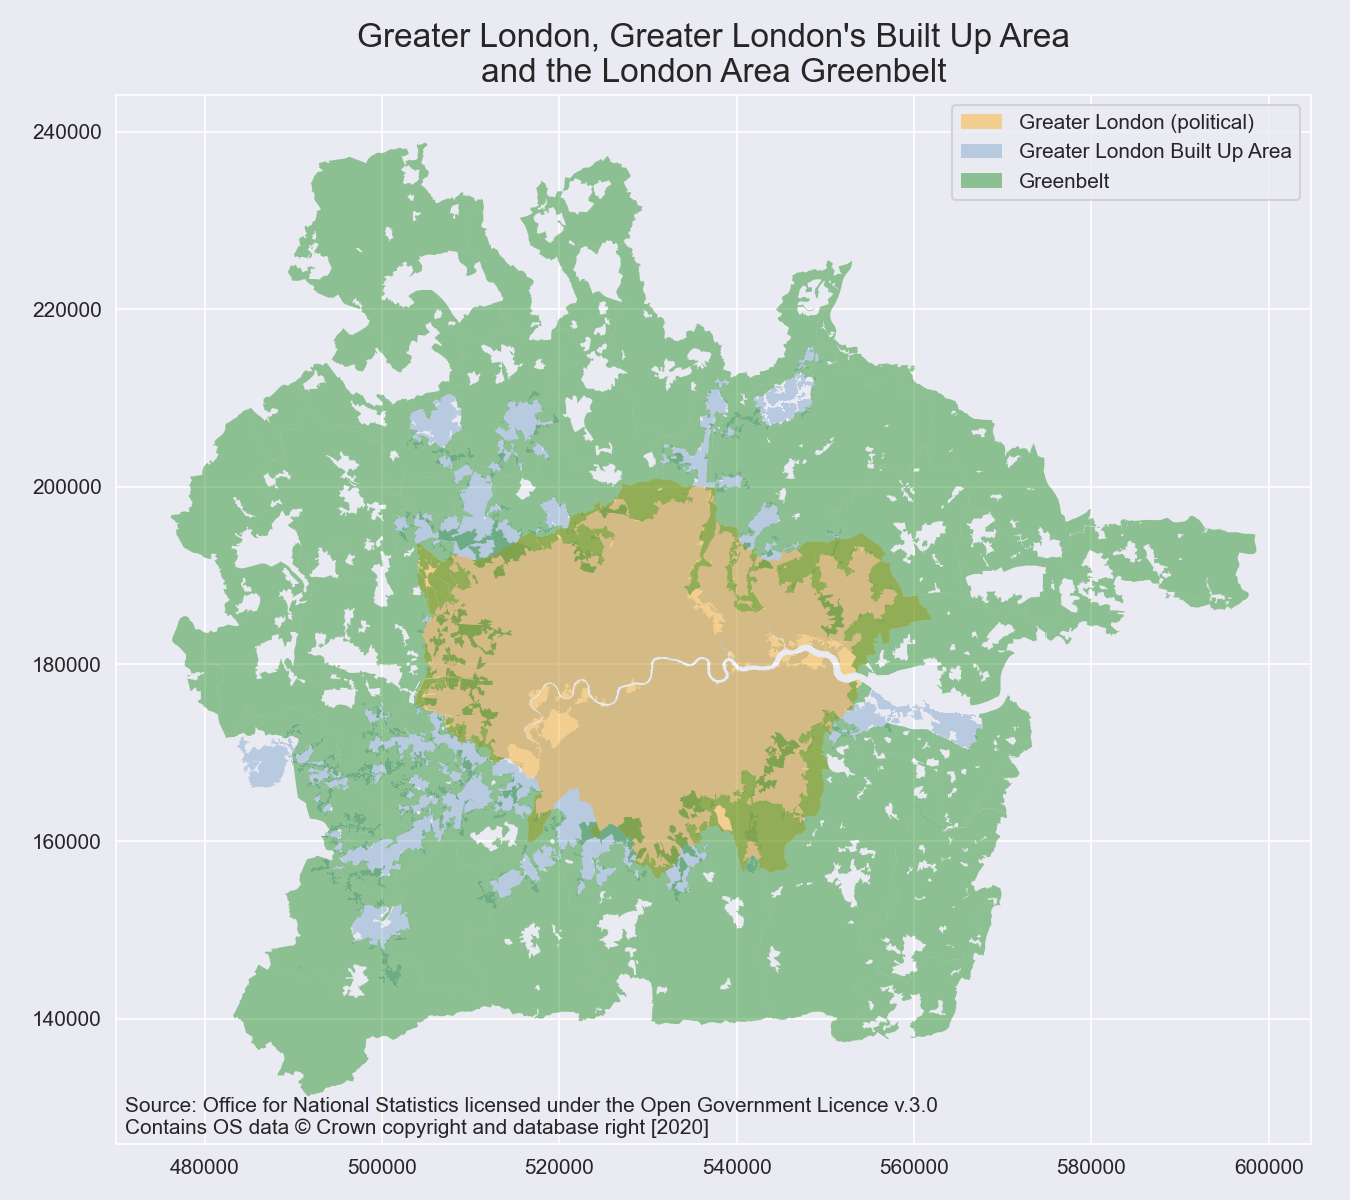
Some of the effects of this are illustrated in the two maps below:

First, we can see that Greater London’s Built Up Area (shown in blue) extends well beyond its political boundary (shown in orange).
Second, as explained above, we can see that the geometry of the Built Up Area omits large areas of green space in the city - the most obvious being the inner edge of the green belt, Richmond Park, the Lee Valley etc. As shown in the table below, this results in the average dwelling density within the political boundary being even lower than that highlighted in the previous post for the built up area. No dwellings have moved, been demolished or been built, it is just that the boundary around them has been defined in a different way.
| Definition | Dwellings | Area_ha | Dwellings_ha |
|---|---|---|---|
| Greater London Built Up Area | 4035768 | 173789.7 | 23.2 |
| Greater London (political) | 3358163 | 157350.81 | 21.3 |
Third, the mismatch between Greater London’s political boundary and its built up area is significant but the mismatch with its green belt is even greater. The London Area Greenbelt is nearly three times larger than Greater London’s Built Up Area and 93% of it lies outside Greater London’s political boundary.
