There is a general narrative around urban development that high density development is more sustainable than low density development because it makes more efficient use of land and can better support public services. But what is high density? What is low density? What happens when we try to put numbers against them?
Greater London
Greater London’s need for new housing is set out in a document called the Strategic Housing Market Assessment (SHMA). The 2017 SHMA determined that around 65,000 new homes need to be built in the capital every year between 2016 and 2041. Crudely this equates to a total of over 1.6 million new homes.
The Oxford-Cambridge Arc
Outside of London, The National Infrastructure Commission (NIC) has proposed a band of development called ‘the arc’ stretching from Oxford via Milton Keynes to Cambridge. The NIC’s report “PARTNERING FOR PROSPERITY: A new deal for the Cambridge Milton Keynes-Oxford Arc” proposes delivering up to one million new homes by 2050 in settlements ranging from “smaller scale garden towns of around 10,000 homes through to new city-scale developments of up to 150,000 homes.” (p.8-9)
What density should these developments happen at?
What density should these be developed at, particularly in the case of the arc where new settlements are planned from scratch? One starting point would be to look at London’s existing density policies and see if we can get a sense of appropriate density from those.
London’s existing approach to density
For many years density guidelines for new residential developments in London have been set out in the Sustainable Residential Quality Density Matrix. The appropriate density for a site is based on its Public Transport Accessibility Level (PTAL) and setting (Central, Urban, Suburban). Simplified to dwellings per hectare it looks like this:
| Setting | PTAL 0-1 | PTAL 2-3 | PTAL 4-6 |
|---|---|---|---|
| Suburban | 35-75 | 35-95 | 45-130 |
| Urban | 35-95 | 45-170 | 45-260 |
| Central | 35-110 | 65-240 | 140-405 |
Concerned that London’s approach to density was hindering housing supply, in 2016 the GLA commissioned a review of housing density in London. Around the same time the Mayor’s Design Advisory Group published Growing London, a short report that advised that “With developments being proposed in London reaching densities over 3,000 units per hectare, policies need to be updated and research undertaken to better understand the challenges and opportunities of building at such high densities.” (p.42)
The densities being discussed are different by orders of magnitude. Is 35d/ha low density? Is 405d/ha high density? What about 3000d/ha? If you are planning new settlements in the arc, where in that range of densities should you be targeting?
Exisiting densities of towns and cities in England and Wales
An alternative source of information on residential density in England and Wales is the census. The 2011 census provides a benchmark of the densities of existing towns and cities - defined as Built Up Areas (BUA). A notebook that accompanies this blog post processes the data as follows:
- Downloads Built Up Area geometry from the Office for National Statistics
- Downloads Built Up Area census data from nomis
- Joins the geometry and data
- Divides the number of dwellings in each BUA by its area to calculate the residential density
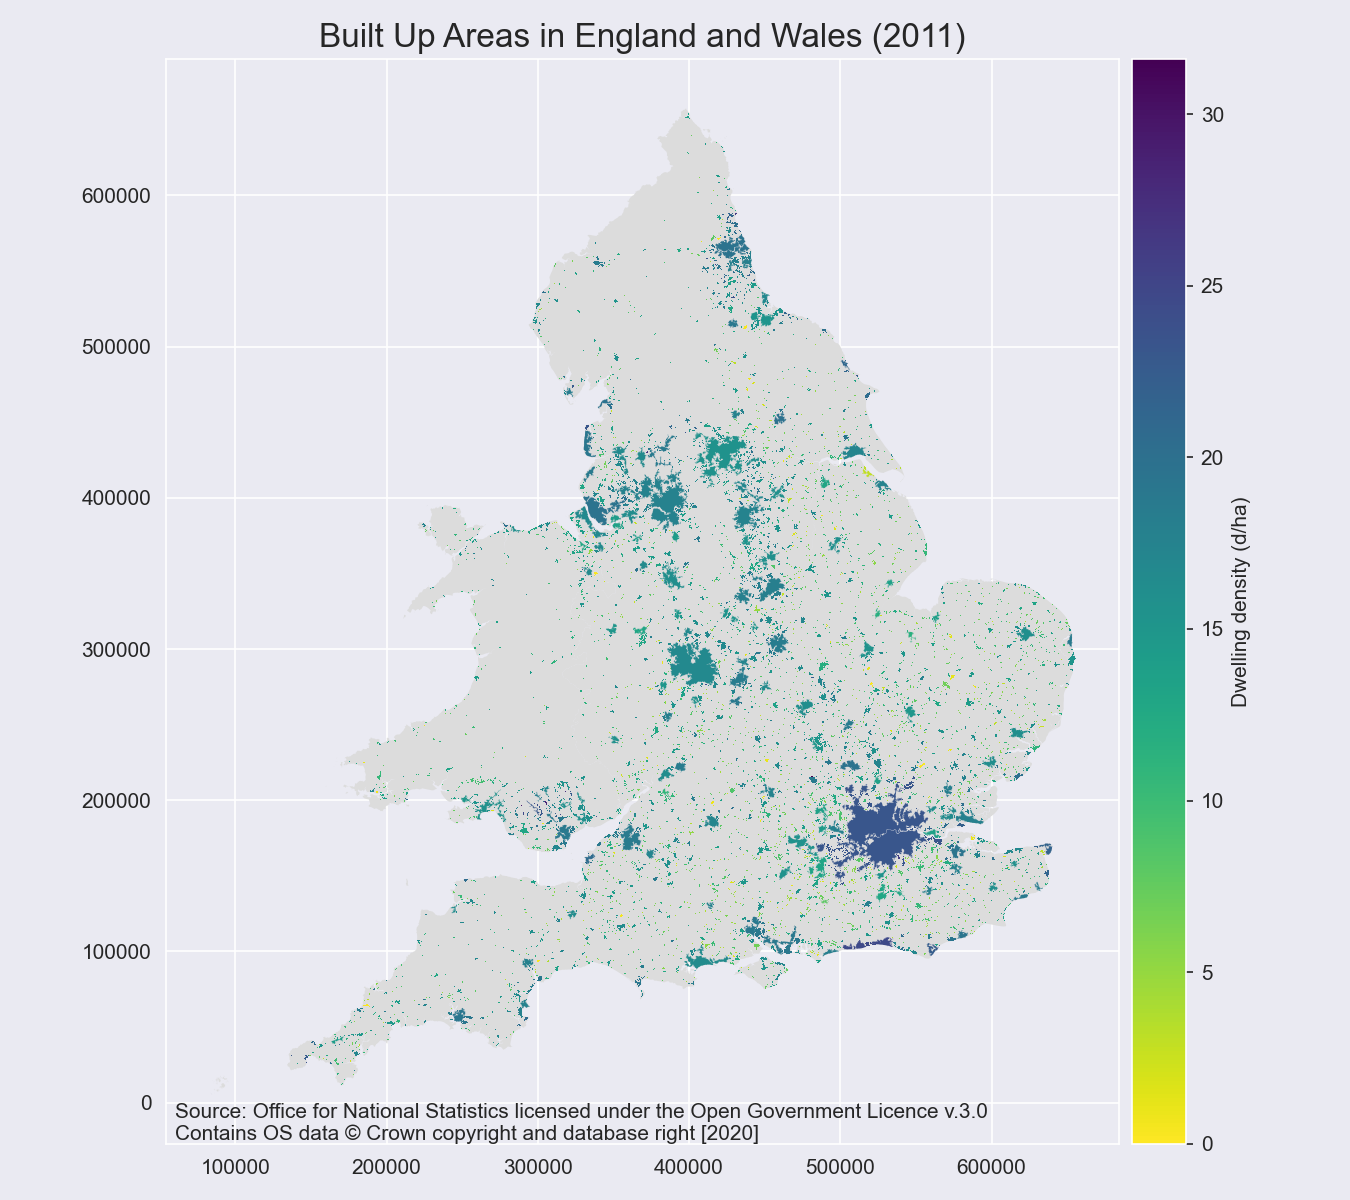
The following map shows the results:

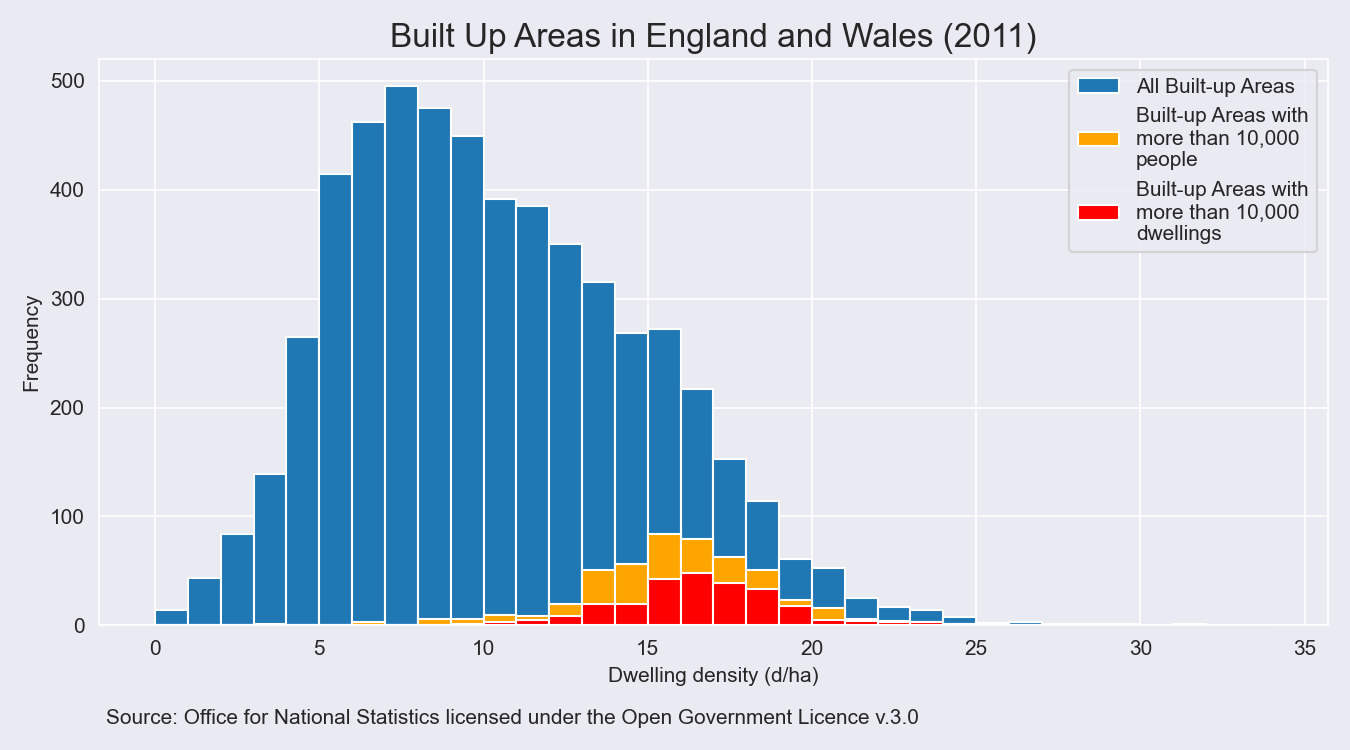
The thing to note is the colour bar which shows that in 2011 no Built Up Area in England and Wales had a dwelling density higher than 32d/ha. If 32d/ha was the maximum density, what was a typical density? To get a better idea of the range of densities we can plot their distribution and look at their summary statistics:

| (d/ha) | mean | standard deviation | min | median | max |
|---|---|---|---|---|---|
| All Built Up Areas | 10 | 5 | 0 | 10 | 32 |
| BUAs >= 10,000 people | 16 | 3 | 3 | 16 | 28 |
| BUAs >= 10,000 dwellings | 17 | 2 | 10 | 16 | 25 |
As the graph and table show, in 2011 the average dwelling density (both median and mean) of all Built Up Areas in England and Wales was 10d/ha - over three times lower than the lowest residential density in the London Plan.
How can we relate this information to the arc and the garden towns of 10,000 dwellings to city-scale developments of 150,000 dwellings? Filtering the data to extract only towns and cities with 10,000 dwellings or more moves the averages up to 16-17d/ha but the maximum down to 25d/ha. It is worth bearing in mind that these numbers include London.
Are bigger towns and cities denser?
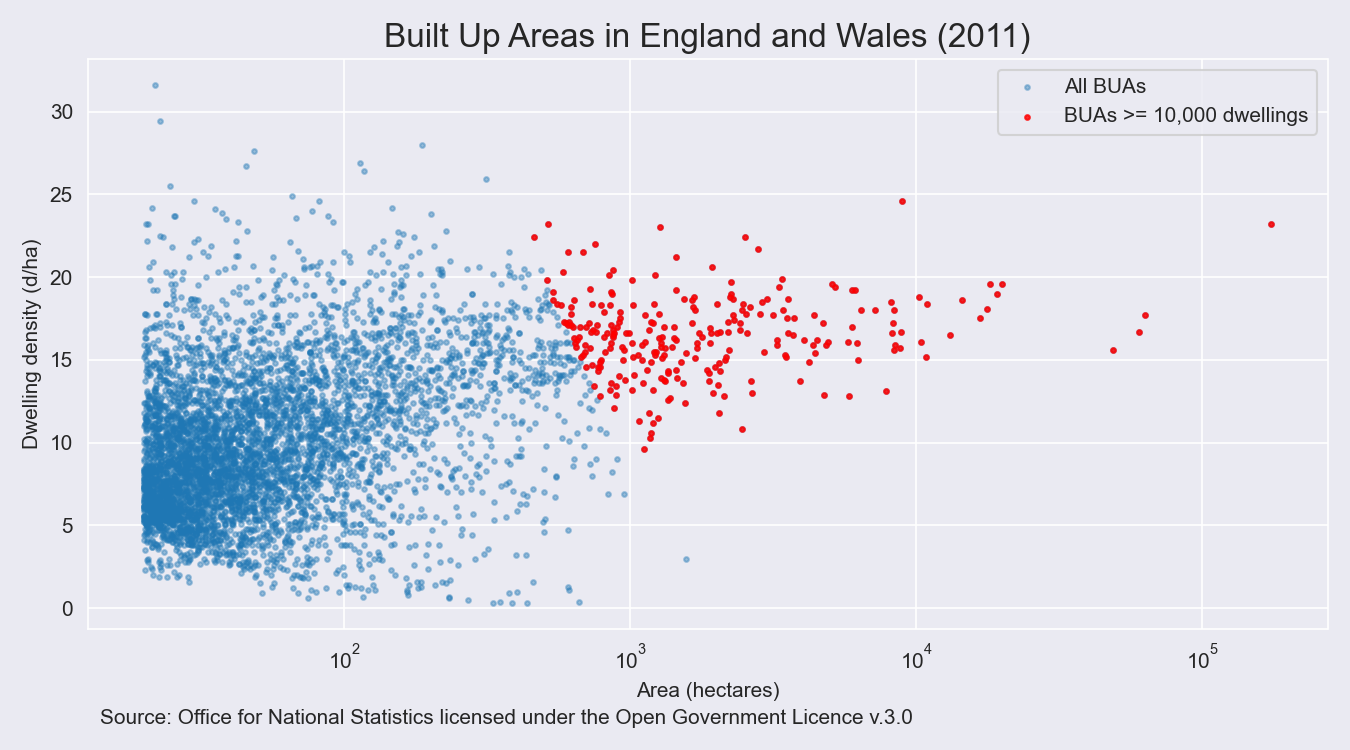
A common assumption might be that bigger towns and cities are denser, to test this we can plot the dwelling density against area:

Clearly the smallest settlements cluster around 7d/ha and the larger settlements do trend upwards towards 23d/ha but 20d/ha appears to be a threshold which few places breach.
What about London itself?
We can identify London in the graph from its size alone or we can extract it from the data:
| BUA Name | Dwellings | Area_ha | Dwellings_ha | |
|---|---|---|---|---|
| 4706 | Greater London BUA | 4035768.0 | 173789.7 | 23.2 |
We are not talking about the same thing
How can it be that London needs design guidance on developing housing at densities of up to 3,000d/ha when its 2011 density was just 23d/ha and the average dwelling density of all Built Up Areas in England and Wales was just 10d/ha?
If we are planning new towns and cities in the arc the densities in the London Plan are clearly inappropriate. Even planning the new settlements at 20d/ha would make them denser than 95% of existing Built Up Areas.
Despite all being expressed in terms of dwellings per hectare and all being calculated simply as the number of dwellings divided by the area of land that they occupy, high density in London’s planning policy (405d/ha) is clearly not the same as high density in design advice given to the mayor (3000d/ha) or the high density of Built Up Areas in England and Wales (32d/ha).